 Work Fixational Eye Movements and Cortical Activity
|
Fig. 1. Constructing a map of the receptive-field activating region (AR) in eye position coordinates.
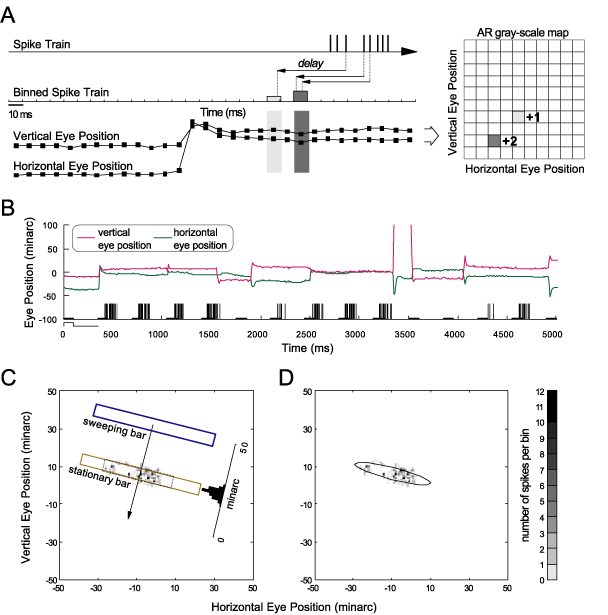 (A) Method of constructing a
gray-scale map of the AR. An optimally oriented, stationary bar was flashed repeatedly in the receptive field of the cell. Schematic spike
train is shown at the top. Spikes were shifted back in time by a delay corresponding to the visual latency and a spike histogram with
bins of +/-5 ms centered on eye position sampling times was constructed. A spatial histogram was prepared (right) where the darkness
of each spatial bin (1x1 minarc) corresponded to the number of spikes fired with the appropriate delay when the eye was in this
particular position. A spatial map was accumulated from several trials like the one shown in panel B. (B) Actual behavioral trial of about
5-s duration (file 2568f010). Eye position (magenta line, vertical, green line horizontal) is plotted along with the spike train (short vertical
lines underneath the eye position traces). The stimulus was flashed (short, thick horizontal lines under spike train), on for 100 ms and
off for 250 ms repeatedly during the trial. Response of the cell depended strongly on vertical eye position because its optimal
orientation was near horizontal. (C) A sweeping bar was used to generate a response histogram (on right side of panel) from which AR
width was measured (thick dashed rectangle). A stationary bar was flashed as shown in panel B to generate responses from which the
gray-scale map of the AR was constructed in eye position coordinates. (D) An elliptical outline of the AR is used for the subsequent
analyses. Minor axis of the ellipse equals width of AR as measured with the sweeping bar (see panel C).
From [1]
(A) Method of constructing a
gray-scale map of the AR. An optimally oriented, stationary bar was flashed repeatedly in the receptive field of the cell. Schematic spike
train is shown at the top. Spikes were shifted back in time by a delay corresponding to the visual latency and a spike histogram with
bins of +/-5 ms centered on eye position sampling times was constructed. A spatial histogram was prepared (right) where the darkness
of each spatial bin (1x1 minarc) corresponded to the number of spikes fired with the appropriate delay when the eye was in this
particular position. A spatial map was accumulated from several trials like the one shown in panel B. (B) Actual behavioral trial of about
5-s duration (file 2568f010). Eye position (magenta line, vertical, green line horizontal) is plotted along with the spike train (short vertical
lines underneath the eye position traces). The stimulus was flashed (short, thick horizontal lines under spike train), on for 100 ms and
off for 250 ms repeatedly during the trial. Response of the cell depended strongly on vertical eye position because its optimal
orientation was near horizontal. (C) A sweeping bar was used to generate a response histogram (on right side of panel) from which AR
width was measured (thick dashed rectangle). A stationary bar was flashed as shown in panel B to generate responses from which the
gray-scale map of the AR was constructed in eye position coordinates. (D) An elliptical outline of the AR is used for the subsequent
analyses. Minor axis of the ellipse equals width of AR as measured with the sweeping bar (see panel C).
From [1]
|
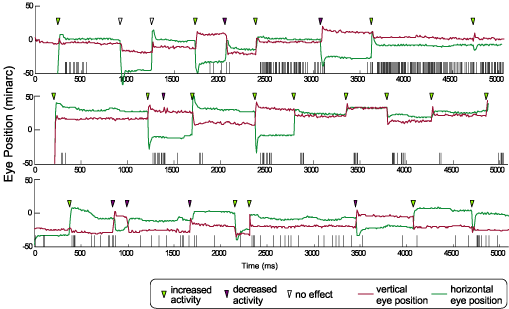
Fig. 2. Eye position and spike trains from cells with three different types of eye-movement-related activity. During behavioral trials
of about 5-s duration, the receptive field was moved over and around a stationary, steadily illuminated bar of optimal size, color, and
orientation by the fixational eye movements. Top panel. Position/drift cell 25683 (file 11). This cell had a tiny AR about 6 minarc wide
and no spontaneous activity. Middle panel. Saccade cell 26682 (file 8). This cell had an AR about 20 minarc wide and no spontaneous
activity. Bottom panel. Mixed cell 30682 that was activated during drifts and also fired bursts after saccades (file 15). This cell had
an AR about 30 minarc wide, 0.5 spikes/s spontaneous activity, and it was direction selective. Inverted triangles above the eye position
traces denote saccade occurrences. Saccades were classified according to the influence they exerted on the neuron’s activity as
described in Methods: Magenta triangles - saccades followed by decreased activity. Green triangles - saccades followed by increased
activity. Empty triangles - saccades that had no effect (equal numbers of spikes in the 250 ms before and the 250 ms after the saccade).
From [1]
|
|
Fig. 8. Saccade-triggered average spike histograms.
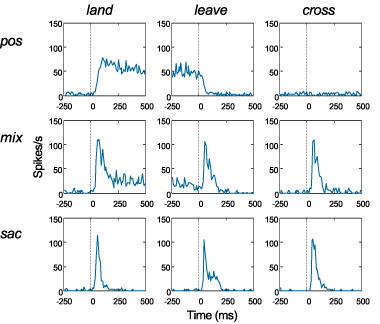 Saccade-triggered average spike histograms for position/drift activated cells (pos, n=10), mixed cells (mix, n=11), and
saccade cells (sac, n=7) when saccades caused the AR to land on the stimulus (first column), leave the stimulus (second column),
or cross the stimulus without remaining on it (third column). Saccades occurred at t 50. For each cell, data were based on five saccades
causing the AR to land on the stimulus and five saccades causing the AR to leave the stimulus. Because the monkeys maintained gaze
within a compact region, saccades sweeping the AR across the stimulus without remaining on it were less frequent. Four or five
crossing saccades were analyzed for 15 cells, three saccades for four cells, and two saccades for nine cells.
From [1]
Saccade-triggered average spike histograms for position/drift activated cells (pos, n=10), mixed cells (mix, n=11), and
saccade cells (sac, n=7) when saccades caused the AR to land on the stimulus (first column), leave the stimulus (second column),
or cross the stimulus without remaining on it (third column). Saccades occurred at t 50. For each cell, data were based on five saccades
causing the AR to land on the stimulus and five saccades causing the AR to leave the stimulus. Because the monkeys maintained gaze
within a compact region, saccades sweeping the AR across the stimulus without remaining on it were less frequent. Four or five
crossing saccades were analyzed for 15 cells, three saccades for four cells, and two saccades for nine cells.
From [1]
|
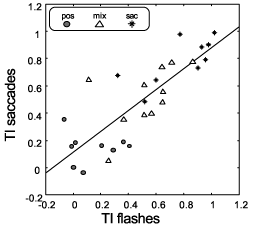
Fig. 11. Transiency index, TI, for saccadic activation with a stationary,
steadily illuminated stimulus compared with activation by a briefly flashed
stimulus.
Each data point is derived from one neuron and a least-squares
regression line has been fit to the data. Flash durations ranged from
50–450 ms. Numbers of neurons in each category are nine saccade-activated,
nine position/drift-activated, and 11 mixed.
From [1]
|
References:
[1] Snodderly D.M., Kagan I., Gur M. (2001) Selective activation of visual cortex
neurons by fixational eye movements: Implications for neural coding.
Visual Neuroscience
18 (2): 259-277
[reprint]
[better resolution figures]
ResearchIndex entry